



cropping
Wheat
- GVP record level of $4.3 billion est., up 43% year-on-year
- 12.9 million tonne crop was the second highest on record
- Exports valued at $1.9 billion, with 63% sent to South East Asia
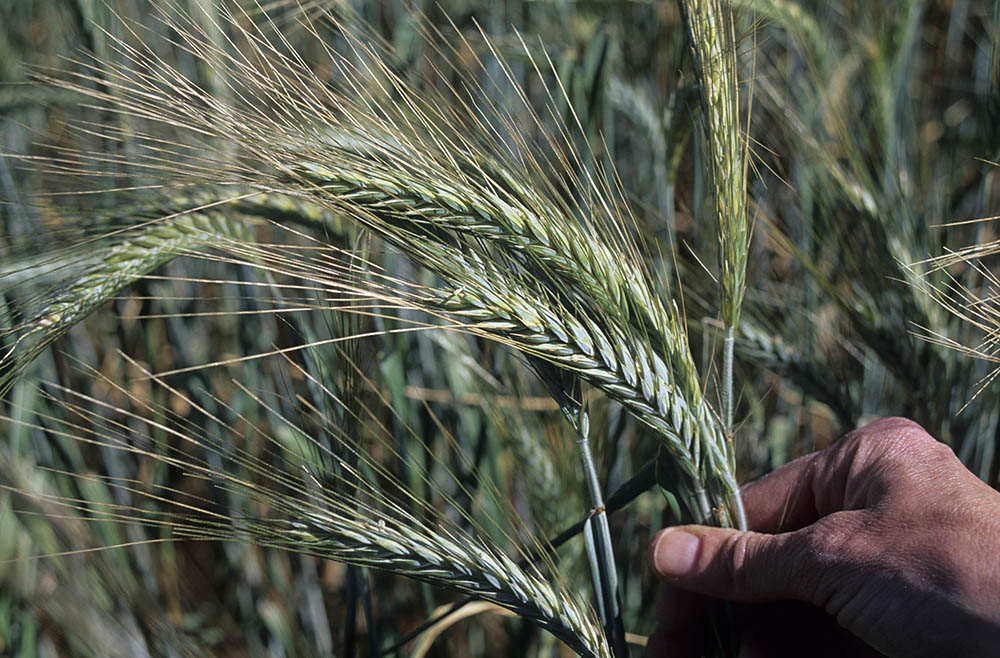
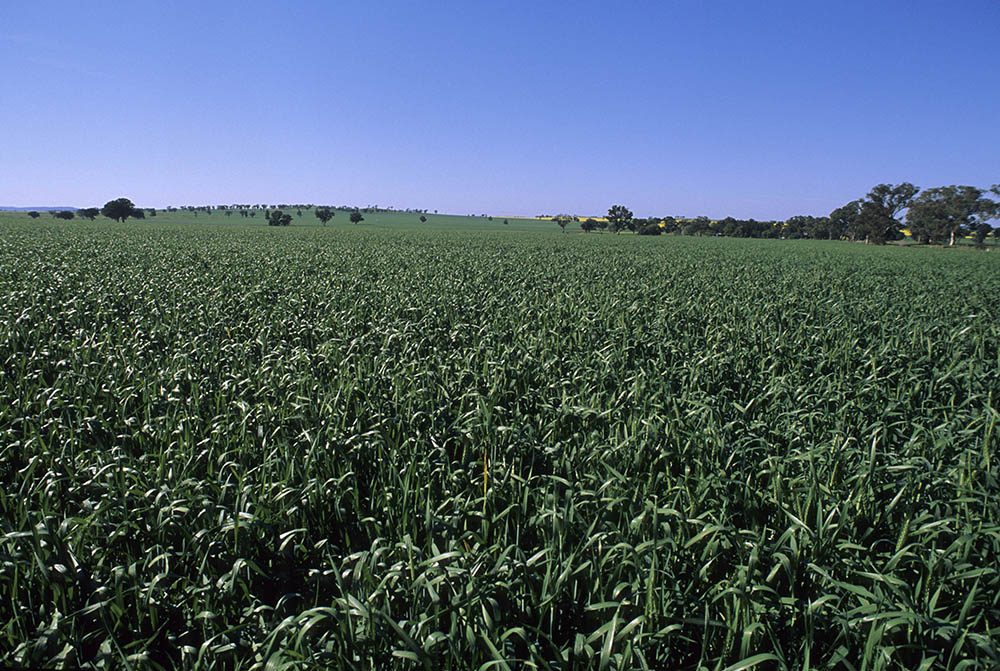
Production
Rainfall following the previous years dry finish, was mostly average to above average from November 2023 leading into the 2024-25 crop for most of the cropping regions of NSW. 51 A widespread seasonal break during April led to average to above average root zone soil moisture for most of the NSW cropping belt, promoting timely sowing and an expanded planted area. 52
Price
Wheat prices were rangebound for a range of factors. Providing price support was a significant drop in Russian wheat production and exports which have displaced substantial amounts of Australian wheat over the last 2 years. 194 China’s share of NSW wheat exports have fallen from 26% in 2022-23 to 7% in 2024-25. 155 Offsetting this was downward pressure created from record global wheat production which outpaced global growth in consumption. 194 As a result, export prices generally trended in a similar pattern with any upside kept in-check under the weight of the record global production and aggressive export pricing.
International Wheat Export Price Indicators
Macroeconomic Conditions
Global Wheat Supply Demand and Stocks
Global wheat production set a new record in 2024-25 for the fifth consecutive year, reaching an estimated 801 million tonnes. Australia was the largest contributor to the increase in global production in volume terms, while Canada, Kazakhstan, China and the US were among the other major wheat producing nations to see production increase also. This was partially offset by significant decline in production from Russia of approximately 9.9 million tonnes which compounded the 13.5 million tonne decline from the European Union. 194 This brought Australian wheat export prices broadly back in line with US and Russian export prices in USD terms. 87
Global consumption remained stable year on year, while global ending stocks continued to decline from their peak of around 297 million tonnes in 2019-20, and now sit 12% lower after 5 years. 194
The Australian dollar remained relatively weak against the US dollar, which provided a competitive edge for Australian wheat in international markets. This currency advantage partially offset the impact of lower global prices, helping support higher export volumes. 147
Trade
The increased global supply diminished Australian wheat pricing power in export markets. Combined with an increase in lower grades and overall protein levels led to average NSW wheat export prices declining on the year prior. 155
Increased export demand and activity emanated mainly from key South East Asian nations including Indonesia, Philippines, Vietnam, Thailand and Malaysia with exports increasing 136% year-on-year and these five markets accounting for 62% of NSW wheat exports by value. 155 This has been offset by a large decline in demand from China, with exports declining 86% from their peak in 2022-23 when China made up 27% market share of NSW wheat exports. Since 2021, Australia has been the largest supplier of wheat to China with exports surging while exports from competitors declined. Australian export volumes have since normalised levels recently in parallel with a reduction in Chinese total imports, and therefore maintains a significant market share. 175 194
NSW wheat exports have limited exposure to the US and therefore any direct impacts from US tariffs are expected to be negligible. However, NSW is a key processor of wheat gluten, with $273 million of exports in 2024-25 with the US representing a 76% market share. 155 Australia accounted for approximately 48% of US wheat gluten imports between 2022 and 2024, and given the tariff applied to Australian exports is lower than most other trading partners, the main challenge will be maintaining competitiveness with US domestic processors. 175
Outlook
Conversely, northern NSW has benefited from timely rainfall, placing crops in a strong position heading into spring. The spring outlook suggests a 60–80% chance of above-average rainfall across NSW cropping regions, which could support late-season growth and yield recovery. 3 53 National wheat production is forecast to decline marginally with lower production in NSW forecast to be partially offset by a return to average production levels in Victoria and South Australia, which will assist in bringing interjurisdictional pricing into more alignment. 3
Global wheat production and consumption are both expected to hit new record high levels in 2025-26, however the balance sheet will remain tight with the global stocks to use ratio remaining steady. 181 Supply from the European Union in particular is forecast to rise by 13%, while production in India is forecast to lift by 4%, which could add to price weakness. 181


