

Australian Biomass for Bioenergy Assessment (ABBA) Project
The Australian Biomass for Bioenergy Assessment (ABBA) Project ran from 2015 to 2021 and was funded by the Australian Renewable Energy Agency (ARENA). The NSW DPIRD Forest Carbon team was responsible for the biomass data collection and will continue as custodians of the New South Wales biomass datasets. The purpose of the ABBA Project was to catalyse investment in the renewable energy sector through the provision of detailed spatial information about biomass resources across Australia, which can assist in project development and decision making for new bioenergy projects, and provide linkages between biomass supply, through the supply chain, to the end user.
The ABBA biomass datasets are actively maintained and updated by the Forest Carbon team and we provide the data publicly through two online platforms (discussed below), which enable users to visualise and extract existing biomass data as well as determine the potential for new woody biomass crop plantings and support a range of applications including bioenergy use (coming soon - liquid biofuels, biochar and industrial heat).
The Cropping, Forestry, Solid Organic Waste and Livestock biomass residue datasets were recently updated in 2024-25 to more recent timeframes and the Horticulture datasets will be updated throughout 2026.
NSW spatial data on the Terria Map platform
The ABBA project collected, calculated and mapped, on a state by state basis, data on the location and potential volumes of biomass from a wide range of industries for inclusion on the Terria Map platform. Click - Explore Data > Australia > National Datasets > Energy > Renewable Energy > Bioenergy > New South Wales to access the NSW statewide biomass spatial datasets. Every dataset has detailed information about the calculation of the residues. Toggle between the different residue layers loaded and click on a polygon on the map to return information about biomass in that location for the active layers. Use the side-by-side tool to compare two layers.
The key NSW biomass sources that have been captured so far are listed below.
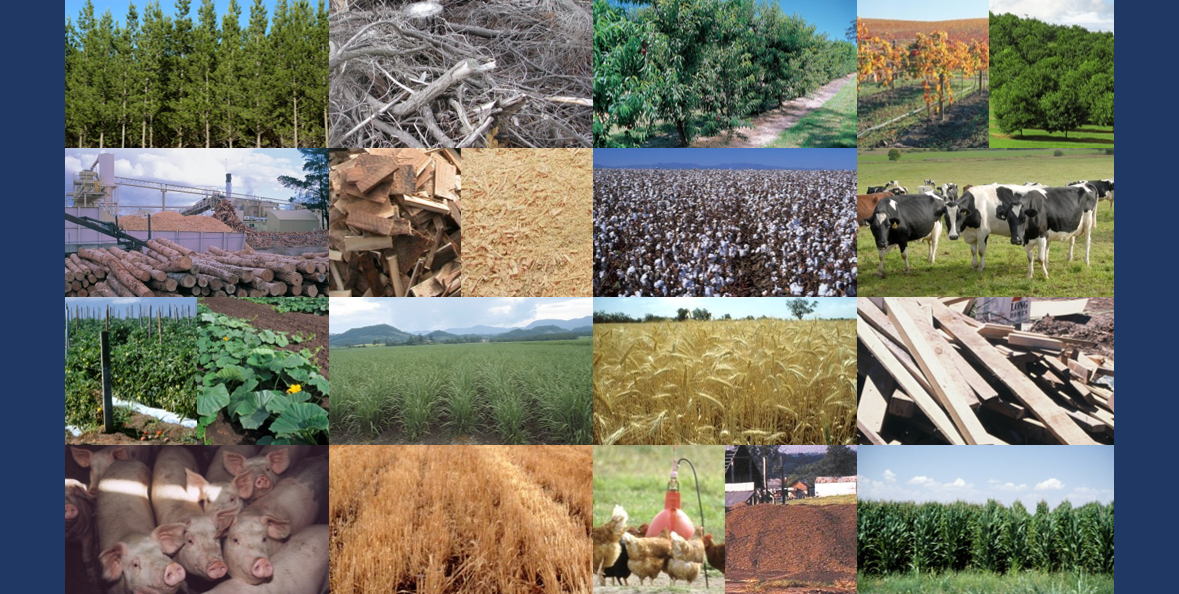
- Forestry residues - harvesting and sawmilling
- Solid organic waste - MSW, C&I and C&D
- Cropping residues - straw/hay/silage, crop-specific residues (bagasse, hulls, gin trash)
- Livestock residues - manure
- Horticultural residues - shells/hulls/husks
- Additional national layers including sugarcane and winery residues
The data can be viewed in conjunction with a multitude of other relevant spatial layers on the Terria Map platform, to enhance the visual interpretation and understanding of the data and its location in relation to other biomass sources, towns, transport networks, electricity networks, ports, existing landuse, population statistics and many more.
NB: The National Map platform was decommissioned on 30 June 2025 and our spatial data now resides on the Terria Map platform. The Terria Map platform is identical in appearance and use to the previous National Map platform.
NSW spatial data in the NSW BioSMART Tool
NSW BioSMART is an interactive spatial tool that enables users to determine the potential for using biomass in NSW for a range of applications. The biomass data within the tool is derived from the ABBA spatial data plus additional spatial data identifying potential lands suitable for new woody biomass crop plantings.
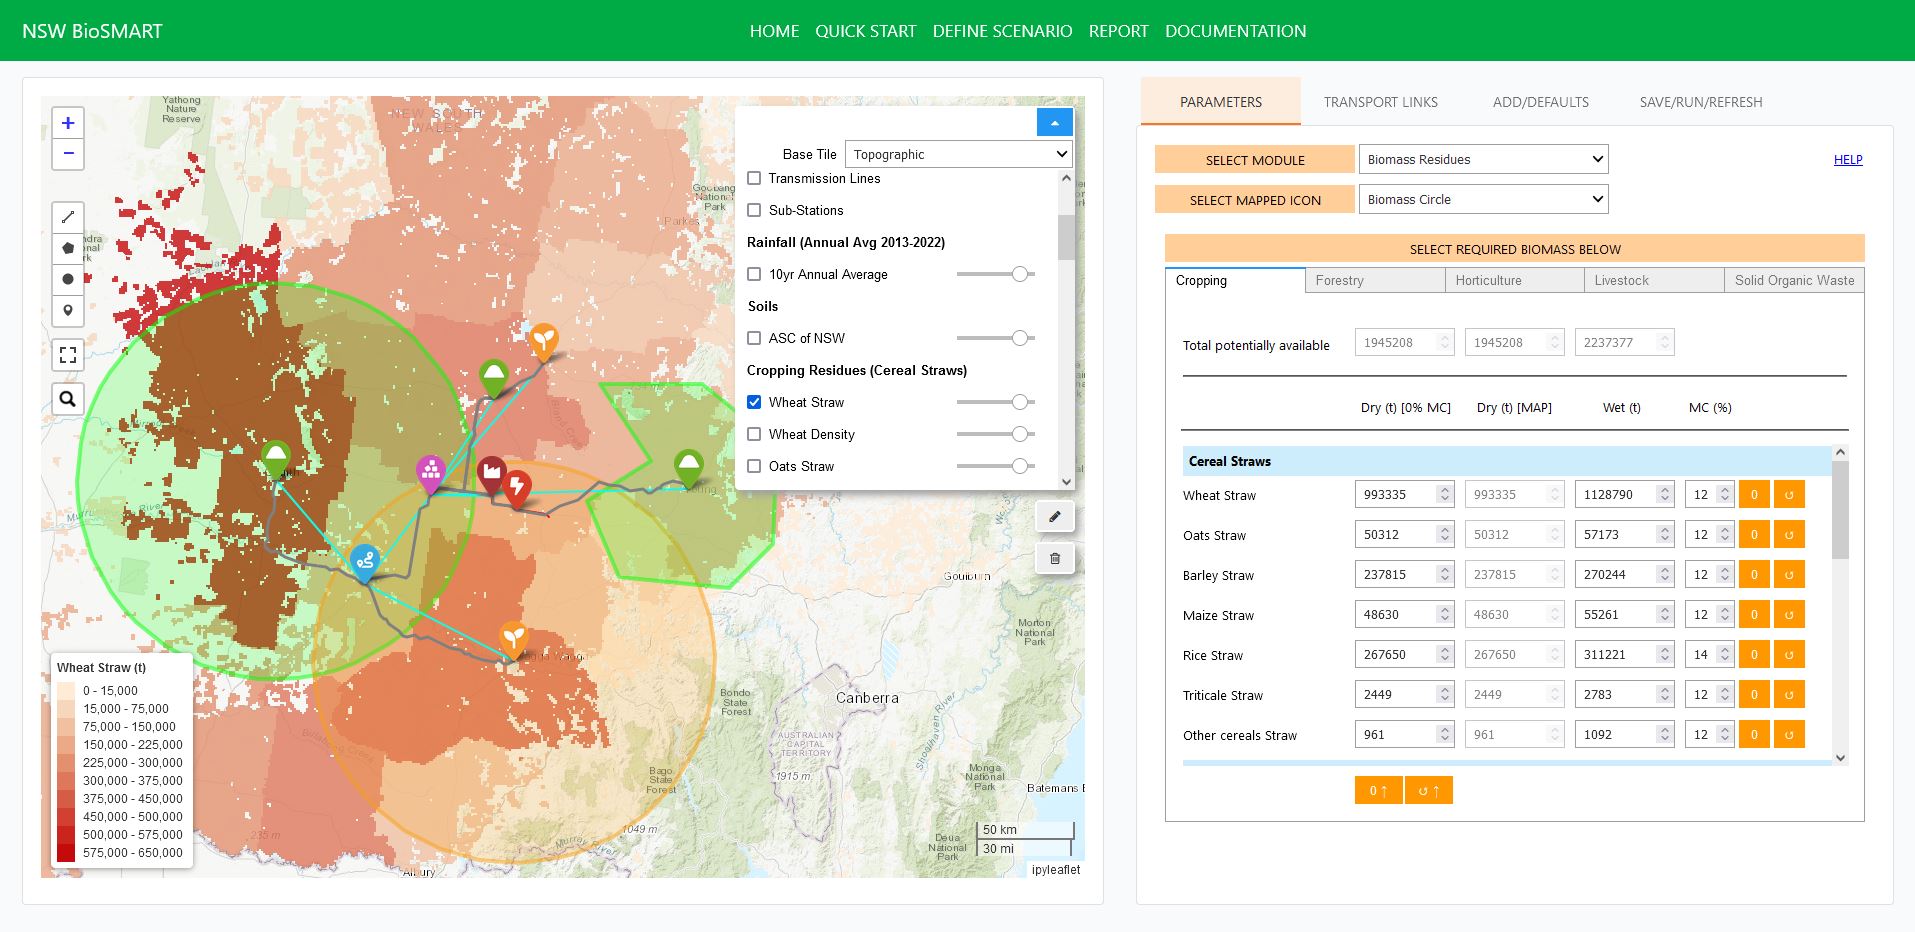
The need for a biomass analytical tool has long been identified as essential to support the growth of a viable biomass industry and we have developed this tool under the Biomass for Bioenergy Project. The tool is built so users are able to vary most default parameters as required. The underlying ABBA biomass data will be kept current by NSW DPIRD.
Version 1 of the tool has focused on electricity generation options as the end use for biomass - future versions will include other end use options including industrial heat applications, liquid biofuels and biochar.
NSW ABBA biomass residues - interactive chart and table
This interactive chart allows the user to explore the currently calculated NSW biomass residues through an infographic, displaying both the total residues and the percentage share of the group for the state. Note that this is not an exhaustive list of potential biomass available in NSW, but matches what has been captured by the ABBA mapping.
The current capture timeframe for the NSW ABBA biomass groups reflected in this infographic and the table below (and represented on Terria Map platform and our NSW BioSMART tool) are listed here. The volumes presented are the annual average of these timeframes.
- Forestry group: 2013-23 FY (10-year annual average)
- Solid organic waste group: 2018-23 FY (5-year annual average)
- Cropping group: 2011-21 FY (10-year annual average)
- Livestock group: 2011-21 FY (10-year annual average)
- Horticulture group: 2013-18 FY (5-year annual average)
- Except Winery residues: 2017 CY (1-year) - National layer
Additional datasets may be included subject to availability of funding. This interactive chart is not fully accessible - see the table below the interactive chart which contains the data behind this infographic.
How to use the interactive chart
The chart contains three levels of information. Hover over the chart to see a snapshot of the residue volumes and the categories below this level. Choose a level: Level 1, Level 2 or Level 3 to explore the data in more or less detail.
- Level 1 - contains the total volume and percentage share of residues calculated for a defined group (Cropping, Solid Organic Waste, Livestock, Forestry and Horticulture)
- Level 2 - contains a more detailed look at the categories that make up the Level 1 groups (such as Cropping - Cereal Straw, Non-cereal Straw, Sugarcane Residues)
- Level 3 - contains the most detailed information and delves into the residue classes that make up the Level 2 categories (such as Cereal Straw - Wheat Straw, Barley Straw, Rice Straw)
Table of NSW ABBA biomass residues
| Level 1 | Level 2 | Level 3 | |||
|---|---|---|---|---|---|
| Group | Volume (DT) | Category | Volume (DT) | Residue Class | Volume (DT) |
| Cropping (2011-21 FY annual average over 10yr timeframe) |
11.6M | Cereal Straw | 7.94M | Wheat Straw | 5.39M |
| Oats Straw | 268K | ||||
| Barley Straw | 1.33M | ||||
| Sorghum Straw | 232K | ||||
| Maize Straw | 121K | ||||
| Rice Straw | 548K | ||||
| Other Cereals Straw | 51K | ||||
| Non-cereal Straw | 1.86M | Cotton Straw | 380K | ||
| Canola Straw | 1.29M | ||||
| Other Oilseeds Straw | 35K | ||||
| All Pulses Straw | 155K | ||||
| Hay and Silage | 1.15M | Hay | 907K | ||
| Silage | 244K | ||||
| Sugarcane Residues | 510K | Bagasse | 249K | ||
| Sugarcane Trash | 261K | ||||
| Rice Residues | 97K | Rice Hulls | 97K | ||
| Cotton Residues | 38K | Cotton Gin Trash | 38K | ||
| Level 1 | Level 2 | Level 3 | |||
| Group | Volume (DT) | Category | Volume (DT) | Residue Class | Volume (DT) |
| Solid Organic Waste (2018-23 FY annual average over 5yr timeframe) |
10.2M | Municipal Solid Waste (MSW) | 5.29M | Food | 1.58M |
| Paper or Cardboard | 707K | ||||
| Vegetation or Compost | 2.87M | ||||
| Wood or Wood Products | 137K | ||||
| Commercial & Industrial (C&I) | 3.79M | Food | 391K | ||
| Paper or Cardboard | 2.1M | ||||
| Vegetation or Compost | 702K | ||||
| Wood or Wood Products | 600K | ||||
| Construction & Demolition (C&D) | 1.11M | Paper or Cardboard | 116K | ||
| Vegetation or Compost | 136K | ||||
| Wood or Wood Products | 853K | ||||
| Level 1 | Level 2 | Level 3 | |||
| Group | Volume (DT) | Category | Volume (DT) | Residue Class | Volume (DT) |
| Livestock (2011-21 FY annual average over 10yr timeframe) |
2.31M | Manure Residues | 2.31M | Beef Feedlot Manure | 1.53M |
| Dairy Manure | 147K | ||||
| Piggery Manure | 56K | ||||
| Poultry Manure | 575K | ||||
| Forestry (2013-23 FY annual average over 10yr timeframe) |
1.66M | Harvest Residues | 992K | Native Cypress | 3.3K |
| Native Hardwood | 459K | ||||
| Plantation Hardwood | 77K | ||||
| Plantation Softwood | 453K | ||||
| Sawmill Residues | 665K | Native Cypress | 12K | ||
| Native/Plantation Hardwood | 219K | ||||
| Plantation Softwood | 434K | ||||
| Horticulture (2013-18 FY annual average over 5yr timeframe) |
159K | Nut Residues | 37.6K | Almond Shells | 2.2K |
| Almond Hulls | 7.4K | ||||
| Macadamia Shells | 10K | ||||
| Macadamia Husks | 18K | ||||
| Winery Residues (2017 CY only) |
121K (WT) | Grape Marc | 96K (WT) | ||
| Grape Stalks | 25K (WT) | ||||
*Key: DT = dry tonnes and WT = wet tonnes.
Contact us
For information about this project please email:
Fabiano Ximenes | Leader & Senior Research Scientist
fabiano.ximenes@dpird.nsw.gov.au
Catherine Carney | Research Officer
cath.carney@dpird.nsw.gov.au
