

Leaf analysis as a tool for managing southern highbush blueberry crops
A CCC research update on the nutrient status of southern highbush blueberry in Australia
Dr Sophie Parks, Research Horticulturist, NSW DPIRD - 6 February 2025
Key points:
- Leaves should be collected for anlysis during the summer period, when monitoring crop nutrition status.
- Compare your leaf nutrient values to documented sufficiency ranges - if the results don’t match, review growing conditions and practices.
- Regular leaf analysis can identify nutrient deficiencies or excesses. Leaf analysis can also help guide fertiliser rates to maximise yields while preventing environmental pollution from excess nutrients.
- When diagnosing plant problems, compare leaves from symptomatic plants with those from healthy plants. However, only compare against the documented nutrient sufficiency ranges during the summer season.

How leaf analysis works
The profile of nutrient concentrations in leaves is reflective of plant health. The leaf nutrient profile can be used to guide fertiliser application rates that will ensure yield is not limited. Avoiding excess fertiliser application will also prevent nutrients that are not taken up by the crop, from polluting the environment.
To conduct a leaf analysis for blueberries, between 50-75 mature leaves are collected from new growth representative of the crop. The leaves are sent to an analytical laboratory for processing and chemical analysis. The reported concentrations of essential nutrients in the leaves are then compared to the established sufficiency ranges for southern highbush blueberries (as shown in Table 1 below).
Table 1. Leaf sufficiency ranges for essential plant nutrients in southern highbush blueberry.
For accurate comparison with the nutrient sufficiency ranges in Table1, mature leaves from new growth should be collected only during the summer season.
| ELEMENT | UNIT | CONCENTRATION AT SUFFICIENCY * |
|---|---|---|
| Nitrogen | % | 1.44-1.65 |
| Phosphorus | % | 0.09-0.11 |
| Potassium | % | 0.44-0.72 |
| Calcium | % | 0.62-0.73 |
| Magnesium | % | 0.15-0.27 |
| Sulfur | % | 0.15-0.17 |
| Iron | mg/kg | 90-100 |
| Manganese | mg/kg | 186-253 |
| Boron | mg/kg | 14-27 |
| Copper | mg/kg | 6-11 |
| Zinc | mg/kg | 22-116 |
| Molybdenum | mg/kg | 0.02-0.05 |
* Based on Bryson, G.M., and Mills, H.A. (2015). Plant Analysis Handbook IV - a Guide to Sampling, Preparation, Analysis and Interpretation for Agronomic and Horticultural Crops (Micro-Macro Publishing Inc.): www.researchgate.net/publication/271849765_Plant_Analysis_Handbook_IV
Leaf analysis, conducted as part of a crop monitoring program, can identify unbalanced nutrition that might not otherwise be detected, such as the “hidden hunger” of nutrient deficiencies. Leaf analysis can also identify 'luxury' levels of some nutrients in plant tissue, that is, nutrients that have accumulated beyond the physiological needs of the crop.
Once unbalanced nutrition has been identified, fertiliser supplies can be reviewed and revised. However, many other factors can affect plant nutrient status (such as disease, the supply of water or light, and soil or substrate characteristics), making the interpretation of leaf analyses an art that needs to be made in the context of the crop and its growing conditions.
When symptoms appear
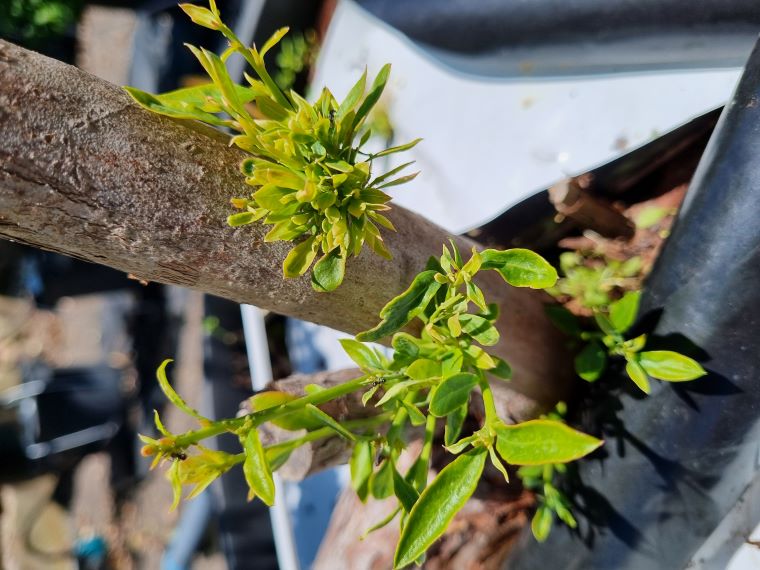
Leaf analysis can help to diagnose plant problems that appear without an obvious cause.
In this situation it’s useful to record as much information as possible about the plants in question, including tissue type and maturity, the location of symptoms within the crop, and any recent changes in the weather, growing conditions, or crop management practices.
However, if the problem does not occur in summer, the sufficiency ranges in Table 1 will not be relevant for leaf analysis interpretation. During autumn, winter and spring, collect mature leaves from the most recent growth from affected plants. Also collect leaves from healthy unaffected plants, and send both sets of leaves to the lab for analysis. Comparing the analysis results for each sample can help to determine the problem affecting the unhealthy plant.
The possible causes of plant symptoms are endless and may not need plant analysis, just some detective work! Simple problems may be relatively easy to identify, such as blocked drippers restricting the supply of water and nutrients to roots, or over-enthusiastic herbicide use sprayed near foliage.
The cause of a plant health problem can also be complicated. In one case identified through leaf analysis, plant symptoms had resulted from increased soil pH following the completion of a limestone path situated next to the crop.
An update on CCC Research
As part of the Clean Coastal Catchments (CCC) Research project, we are investigating the nitrogen needs of evergreen southern high bush blueberry grown on the NSW mid north coast, as a fertigated crop in both soil and potted substrate. We have conducted several seasons of leaf analyses for commercial crops of cultivar 11-11 in the Coffs Harbour area and for our research site crop at Wollongbar.
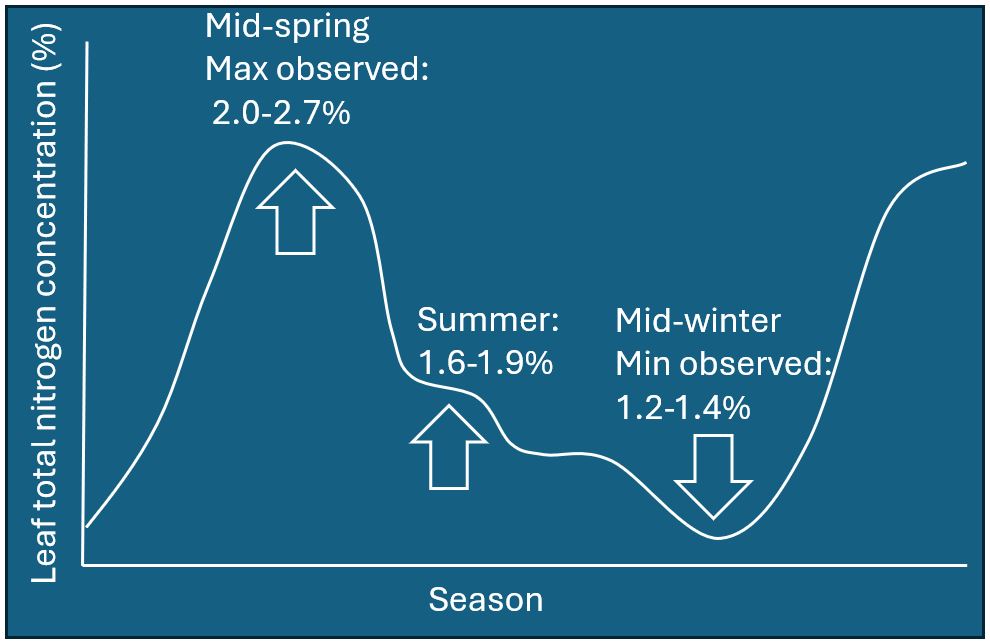
We have observed two key trends in our data. The first trend is the extreme seasonal fluctuation in the concentrations of both nitrogen and phosphorus in plant leaves (Figure 1). Concentrations are at their lowest in winter and at their highest in spring. Summer concentrations are the least extreme, making summer the most appropriate time to collect leaves for analysis and comparison with the sufficiency ranges in Table 1. Sampling in seasons outside of summer would result in reported nitrogen and phosphorus concentrations either well below or well above the documented sufficiency ranges. Modifying fertiliser management in response to non-summer results would therefore be inappropriate.
The second trend is in the comparison of our monitoring results with the sufficiency ranges (Table 1). In the crops we monitored on the NSW mid north coast, nitrogen (1.6-1.9%) and phosphorus (0.15-0.23%), are generally higher than the standard sufficiency range. Calcium (0.18-0.42%) and magnesium (0.1-0.17) are generally lower.
So, why would our monitored crops show such a contrast with the sufficiency ranges?
One hypothesis is that the standard sufficiency ranges are not reflective of evergreen cropping systems. The standard sufficiency ranges are based on deciduous blueberry crops grown in northern America. It may be that the sufficiency needs of nutrients in evergreen blueberry are different to the needs of deciduous types.
Another hypothesis is that nitrogen and phosphorus fertilisers are being over supplied to our monitored crops, which might impede the root uptake of other nutrients. It is possible that excess nitrogen, supplied as urea or as other ammonium forms, could be taken up at the exclusion of calcium and magnesium.
We are currently reviewing our database of chemical analyses from leaf and soil samples to better understand the underlying causes of these trends. We will report the findings in 2025.
During the summer of 2024/2025, we are investigating how the rate of applied nitrogen relates to the resulting nitrogen concentrations in the leaves collected for analysis. We will also examine how nitrogen fertiliser rates relate to the crop yields harvested in 2024. The research findings will be published on this website.
This CCC Research project is delivered by the Department of Primary Industries and Regional Development, and is funded by the NSW Government under the Marine Estate Management Strategy. The ten year Strategy was developed by the NSW Marine Estate Management Authority to coordinate the management of the marine estate.
The information in this article is based on a CCC Research article originally published on pages 92-94 in the Summer 2024 edition of the Australian Berry Journal.
